Baliga and Johnson figures of merit rank semiconductors for power switching and high-frequency power. Baliga’s figure (BFOM = εμEc3) favours materials with a high critical field, so β-Ga2O3, GaN and 4H-SiC lead silicon by factors of hundreds to thousands. Johnson’s figure (Ecvs) favours GaN for RF power.
Key takeaways
- BFOM = ε·μ·Ec3 (Baliga, 1982). It sets the lowest possible drift-region resistance for a given blocking voltage in a vertical unipolar device.
- JFOM = Ec·vs/2π (Johnson, 1965). It sets the trade-off between voltage and transit-time frequency in a transistor.
- Because critical field is cubed in BFOM, small changes in the assumed Ec move the result a lot. Published “×Si” values differ for that reason.
- With common inputs, BFOM relative to Si is roughly 300 to 600 for 4H-SiC, 500 to 950 for GaN and 750 to 3,600 for β-Ga2O3.
- Neither metric includes thermal conductivity, p-type doping, substrate cost or reliability. They screen materials; they do not pick devices.
What is the Baliga figure of merit?
B. Jayant Baliga introduced the figure in a 1982 paper in the Journal of Applied Physics on semiconductors for high-voltage, vertical-channel field-effect transistors. The question he asked was simple: for a power device that must block a given voltage, which material gives the lowest on-resistance?
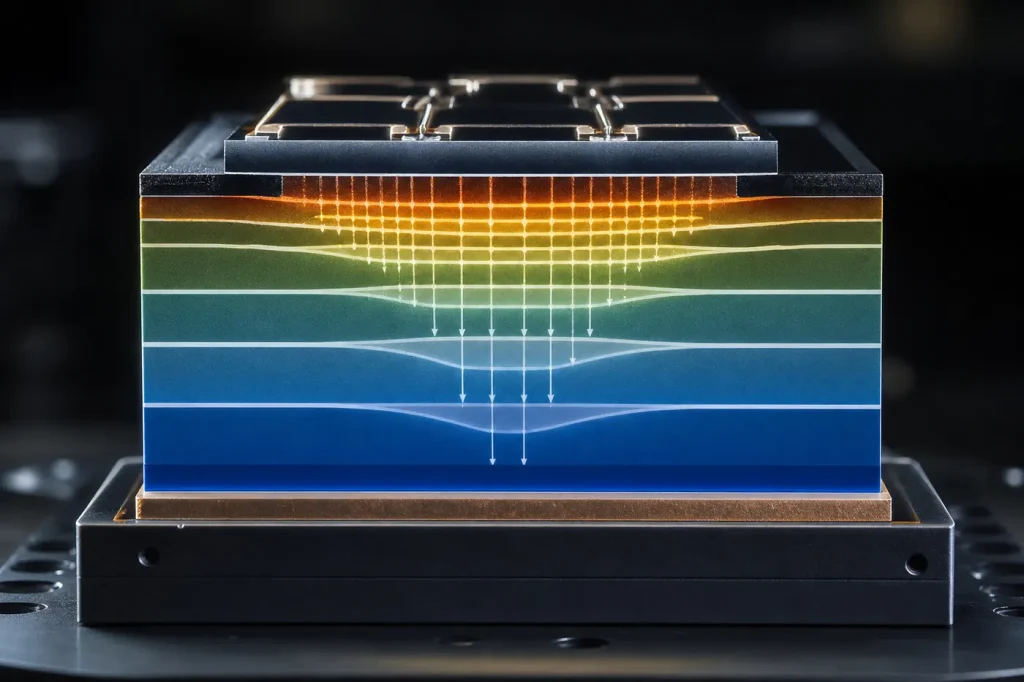
The answer comes from the drift region. That is the lightly doped layer that holds the voltage when the device is off and carries the current when it is on. For an ideal non-punch-through drift region, the specific on-resistance is:
Ron,sp = 4·BV2 / (ε·μ·Ec3)
Here BV is the breakdown voltage, ε is the permittivity, μ is the electron mobility in the drift region and Ec is the critical electric field, the field at which avalanche breakdown begins. The denominator is the Baliga figure of merit:
BFOM = ε·μ·Ec3
A material with ten times the critical field of silicon can, in principle, block the same voltage with a drift layer ten times thinner and doped about one hundred times higher. The combined effect is the cube. That single exponent explains why wide-bandgap materials dominate high-voltage power. Our page on the breakdown field of semiconductors explains how Ec is measured and why it varies with doping.
In 1989 Baliga added a second metric in IEEE Electron Device Letters, aimed at power devices that switch at high frequency. The Baliga high-frequency figure of merit (BHFFOM = μ·Ec2) weighs input capacitance charging losses as well as conduction losses. The squared field makes it less extreme than BFOM.
What is the Johnson figure of merit?
E. O. Johnson of RCA published his figure in RCA Review in 1965, in a paper on the physical limits of frequency and power in transistors. He argued that two material limits cap every transistor: the field a material can sustain before breakdown, and the fastest speed carriers can travel, the saturation velocity vs.
His result links the maximum voltage Vm and the transit-time cutoff frequency fT:
JFOM = Vm·fT = Ec·vs / 2π
A short channel is fast but breaks down at low voltage. A long channel holds more voltage but is slow. The product is fixed by the material. Johnson also gave a power form, (Ecvs/2π)2, so some papers quote the square of the ratio. Check which form a table uses before comparing numbers across sources.
How do Si, GaAs, SiC, GaN and Ga2O3 rank?
The table gives the inputs and the ratios they produce relative to silicon. Inputs are typical 300 K values from the Ioffe Institute NSM archive and the standard texts listed under Sources. Where published inputs spread, the ratio is a range computed from the low and high ends. Readers can substitute their own values: every ratio is (ε/εSi)·(μ/μSi)·(Ec/Ec,Si)3 for BFOM and (Ec·vs)/(Ec,Si·vs,Si) for JFOM.
| Material | εr | μn bulk (cm²/V·s) | Ec (MV/cm) | vs (107 cm/s) | BFOM (Si = 1) | BHFFOM (Si = 1) | JFOM (Si = 1) |
|---|---|---|---|---|---|---|---|
| Si | 11.7 | 1,350 | 0.3 | 1.0 | 1 | 1 | 1 |
| GaAs | 12.9 | 8,500 | 0.4 | About 1.0 | About 15 | About 11 | About 1.3 |
| 4H-SiC | 9.7 | 900 to 1,000 | 2.5 to 3.0 | 2.0 | About 300 to 600 | About 45 to 75 | About 17 to 20 |
| GaN (wurtzite) | 8.9 | 900 to 1,250 | 3.0 to 3.3 | About 2.5 | About 500 to 950 | About 65 to 110 | About 25 to 28 |
| β-Ga2O3 | About 10 | 150 to 300 | 6 to 8 (estimated) | Not well established | About 750 to 3,600 | About 45 to 160 | Formula only |
Three things stand out. First, the order holds whatever inputs you pick: Ga2O3 above GaN above SiC on BFOM, all far above Si and GaAs. Second, the BHFFOM gap is much narrower. The squared field gives GaN and Ga2O3 similar scores, because Ga2O3‘s low mobility counts for more. Third, GaAs scores well on BFOM only because of its very high mobility. Its critical field is too low for high-voltage power, which is why GaAs is an RF and optoelectronic material, not a power one. For more on how SiC compares across other properties, see our comparison of silicon carbide with other semiconductor materials.
What assumptions sit behind the numbers?
Both figures are idealised. They are useful because they strip a device down to the material. They mislead when that stripping removes the thing that actually limits a real part.
- Vertical, unipolar, drift-limited. BFOM assumes current flows vertically through a uniformly doped drift layer and that only electrons carry it. It ignores channel, contact and substrate resistance. At low voltage, below a few hundred volts, the channel often dominates, and BFOM says little.
- Critical field is not a constant. Ec rises slowly with doping. A value quoted for one doping level does not apply to another. Because it is cubed, a 10% change in Ec moves BFOM by about 33%.
- Mobility is bulk mobility. BFOM uses drift-region mobility, which falls with doping and temperature. Plugging in the 1,500 to 2,000 cm²/V·s of an AlGaN/GaN two-dimensional electron gas (2DEG) inflates the GaN figure. Lateral HEMTs need a different, lateral figure of merit that uses sheet charge.
- Anisotropy. 4H-SiC mobility and critical field differ along and across the c-axis. Tables usually quote the c-axis value, which is the direction current flows in a vertical device.
- Room temperature. Values are for 300 K. Real junctions run at 100 °C to 175 °C, where mobility is lower.
- Johnson’s velocity. JFOM uses saturation velocity, not peak velocity. GaAs has a peak electron velocity near 2 × 107 cm/s from transferred-electron effects, but its saturated value is lower. Which one a source uses changes the GaAs ratio.
What are the limits of these metrics?
The bigger problem is what the figures leave out. Each missing factor can overturn the ranking for a real product.
- Thermal conductivity. Ga2O3 conducts heat at roughly 10 to 30 W/m·K depending on direction, against about 330 to 490 W/m·K for 4H-SiC. A device that cannot shed heat cannot use its BFOM. R. W. Keyes proposed a separate thermal figure of merit in 1972 for this reason.
- Doping options. Ga2O3 has no practical p-type doping. That rules out p-n junction edge terminations, bipolar devices and conventional MOSFET structures. GaN p-type doping with magnesium works but has high activation energy.
- Substrates and defects. A material scores the same on BFOM whether it comes on a 150 mm low-defect wafer or a small, costly one. Wafer size, defect density and price decide whether the figure ever reaches production.
- Gate dielectric and reliability. SiC MOSFETs are limited by the SiC/SiO2 interface. GaN HEMTs are limited by trapping and dynamic on-resistance. Neither shows up in a material figure.
- Bipolar devices. IGBTs and PiN diodes use conductivity modulation. Their on-state is not set by drift-layer doping, so BFOM does not apply. That is why silicon IGBTs still compete above 1 kV.
Other material data that matters for a full comparison, including resistivity and permittivity, is collected in our semiconductor properties table and our study of dielectric constants among common semiconductors.
Pick X when
- Use BFOM when you are screening materials for vertical unipolar switches above about 600 V, where drift resistance dominates total on-resistance.
- Use BHFFOM when the switch runs at high frequency and charging losses matter as much as conduction losses.
- Use JFOM when you are comparing materials for RF power transistors, where voltage swing and transit frequency set output power.
- Use neither alone when you are choosing a production device. Add thermal conductivity, doping, wafer supply and reliability data, then compare datasheets. Our side-by-side comparisons do that for the main material pairs.
FAQ
Why do published BFOM values for GaN and SiC differ so much?
Because critical field is cubed. One paper using 3.0 MV/cm for 4H-SiC and another using 2.2 MV/cm will differ by a factor of about 2.5 before mobility is even considered. Always check the inputs.
Does a higher Baliga figure mean a better device?
Only for the drift-layer contribution in a vertical unipolar device. Real devices also depend on channel resistance, packaging, heat removal, gate reliability and cost.
Is the Johnson figure of merit squared or not?
Both forms appear. The voltage-frequency product is Ecvs/2π. The power-frequency form is its square. A table showing GaN at several hundred times Si is usually using the squared form.
Why does Ga2O3 beat GaN on BFOM but not on heat?
Its wider bandgap, about 4.8 eV, gives a higher estimated critical field. But its thermal conductivity is roughly an order of magnitude below SiC, and BFOM does not count heat at all.
Sources
- B. J. Baliga, paper on semiconductors for high-voltage, vertical-channel field-effect transistors, Journal of Applied Physics (1982). Origin of BFOM.
- B. J. Baliga, paper on a power semiconductor device figure of merit for high-frequency applications, IEEE Electron Device Letters (1989). Origin of BHFFOM.
- E. O. Johnson, “Physical limitations on frequency and power parameters of transistors,” RCA Review (1965).
- B. J. Baliga, Fundamentals of Power Semiconductor Devices, Springer.
- Ioffe Institute, New Semiconductor Materials (NSM) archive, characteristics and properties of Si, GaAs, SiC and GaN.